Restaurant Menu Pricing Guide
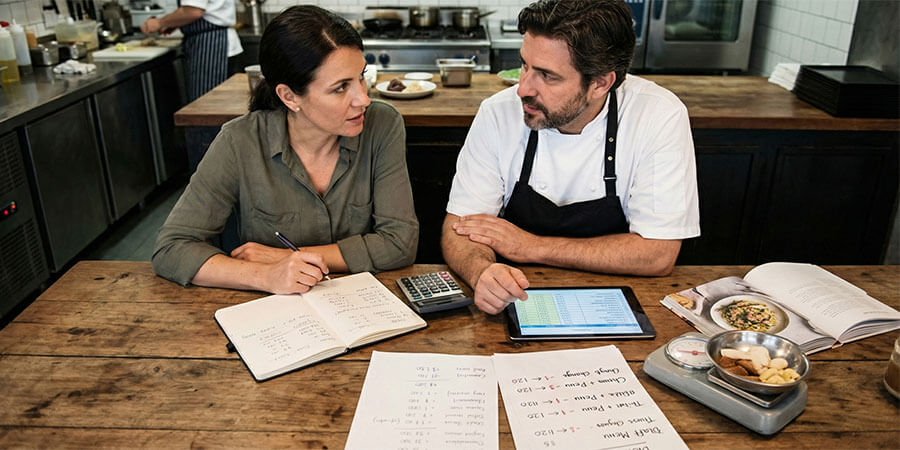
Table of Contents
How to set menu prices that cover your costs, match what guests will pay, and protect your margins as costs change
Pricing is the single biggest lever for restaurant profitability - yet most operators set prices based on gut feeling or competitor imitation rather than data. With restaurant profit margins typically running 5-10% and food costs consuming 20-35% of revenue depending on segment, a small pricing error on a high-volume item can erase your profit entirely. Meanwhile, 82% of consumers believe restaurant prices have risen in the past year and 37% report dining out less frequently as a result. This guide covers how to calculate food cost percentage, set target margins by restaurant type, use pricing psychology to increase average check size, manage price increases without losing guests, and optimize beverage pricing as a profit driver.
Pricing determines whether your restaurant makes money or slowly bleeds it. You can serve exceptional food, deliver great service, and fill every seat - and still lose money if your menu prices do not cover your true costs. The reverse is also true: a restaurant with average food can thrive financially because its pricing is disciplined, strategic, and regularly reviewed.
The challenge is that pricing sits at the intersection of math and psychology. You need prices high enough to cover food cost, labor, overhead, and profit - but low enough that guests perceive value. The National Restaurant Association's 2025 industry research found that 95% of operators say diners are more value-conscious today, yet 64% of full-service customers still say the dining experience matters more than price. That gap between cost pressure and experience expectation is where strategic pricing lives.
This guide covers both sides: the math of building prices that protect your margins, and the psychology of presenting prices in ways that increase what guests are willing to spend.
Understanding Your True Costs
Every menu price must be built on a foundation of accurate cost data. Restaurants that price by instinct or competitor comparison - without knowing their own numbers - are guessing with their livelihood.
Food cost is your starting point. Food cost percentage measures how much of an item's selling price goes to ingredients. To calculate it, divide the total ingredient cost of a dish by its menu price. If a dish costs 30% of its menu price in ingredients, your food cost percentage is 30%. Industry benchmarks vary by restaurant type, and knowing your target is essential.
| Restaurant Type: | Target Food Cost: | Target Profit Margin: | Prime Cost Target (Food + Labor): |
| Quick service | 20-25% | 6-10% | 60% or less |
| Fast casual | 25-30% | Varies by concept | 60-65% |
| Casual dining | 25-30% | 5-8% | 65% |
| Fine dining | 30-35% | 5-7% | 65% or more |
Source: Leverage Buying Group 2025 Restaurateur Benchmark Guide
Prime cost is the number that matters most. Prime cost combines your food cost and labor cost into a single metric - and it is the most reliable indicator of whether your restaurant is financially healthy. The industry benchmark is to keep prime cost under 65% of revenue. If prime cost exceeds 65%, your restaurant is likely unprofitable regardless of how full your dining room is. Every pricing decision should be evaluated against its impact on prime cost, not food cost alone.
Labor cost varies by service model. Quick-service operations typically run 35-40% labor cost because of lower wages offset by higher volume. Casual dining runs 30-40%. Fine dining can run 25% or lower because higher check averages spread labor cost across more revenue per table. Your service model determines how much room you have in food cost - a high-labor concept needs lower food cost to hit the same prime cost target.
Do not forget overhead. Rent, utilities, insurance, marketing, supplies, maintenance, and debt service all must be covered by what remains after food and labor. These costs are relatively fixed - they do not change with volume - which means your menu prices need to generate enough gross profit per guest to cover them whether you serve 50 people or 200.
Cost calculation checklist:
- Calculate the exact ingredient cost for every menu item, including garnishes, sauces, and sides
- Use portion scales to standardize serving sizes and prevent cost variance
- Add labor cost per item (prep time multiplied by hourly wage for the station)
- Calculate your prime cost monthly and compare against the 65% benchmark
- Track food cost weekly - ingredient prices change faster than most operators realize
- Include waste in your cost calculations - restaurants typically waste 4-10% of food purchased
Setting Prices by Food Cost Percentage
The food cost percentage method is the most widely used pricing approach in the restaurant industry. It is straightforward, repeatable, and gives you a consistent framework for pricing any item.
The formula. Divide the total ingredient cost of a dish by your target food cost percentage. If your ingredients cost a certain amount and you are targeting a 30% food cost, dividing the ingredient cost by 0.30 gives you the minimum menu price needed to hit that target. This is your pricing floor - the lowest you should charge before considering perceived value, competition, or margin goals.
Adjust for contribution margin, not just percentage. Food cost percentage tells you efficiency, but contribution margin tells you actual profit. A high-percentage item that generates a large contribution margin per plate can be more valuable than a low-percentage item that contributes less total profit. Track both metrics for every item and prioritize the items that put the most total profit into your operation.
Account for waste and yield. Raw ingredient cost is not the same as usable ingredient cost. A cut of meat has trim loss. Produce has spoilage. Seafood has shell weight. Your food cost calculations must use the cost of the usable portion, not the purchase weight. Proper food storage extends shelf life and reduces the waste that silently erodes your margins.
Build in recipe costing discipline. Every dish on your menu should have a documented recipe with exact quantities and current ingredient costs. When suppliers change prices - and they will - you can immediately see which items are now outside your target margin. Without recipe costing, you discover margin problems months later when your P&L shows declining profit.
Food cost pricing tips:
- Price every item using the food cost percentage formula as your starting point
- Prioritize contribution margin over food cost percentage when deciding which items to feature
- Recost your top 20 items monthly to catch supplier price changes early
- Use yield-adjusted ingredient costs, not raw purchase costs
- Maintain standardized recipes with exact quantities for consistent costing
- Build a 1-2% buffer into your food cost target to absorb normal price fluctuations
Pricing Psychology That Increases Revenue
How you present prices influences what guests order and how much they spend. These are not gimmicks - they are research-backed techniques that work because of how people process price information.
Remove currency symbols where appropriate. Research from Cornell University's hospitality program found that guests spend more when prices are presented as plain numerals without dollar signs. The currency symbol triggers a "pain of paying" response that makes guests more price-conscious. Listing a price as a numeral without a symbol or decimal feels less transactional. This technique works best in full-service and fine-dining environments where the menu is a design element. For quick-service or casual concepts where price clarity is expected, keeping the symbol may be more appropriate.
Do not align prices in a column. When prices are lined up on the right side of the menu, guests can scan the price column without reading descriptions - and many will anchor to the cheapest option. Instead, place the price at the end of each item's description in the same font and size, so it flows naturally after the food information rather than competing with it.
Use price anchoring. Place a premium-priced item at the top of each menu section. Most guests will not order it, but it resets their reference point - everything below it seems more reasonable by comparison. The second and third items in the section, which are typically your highest-margin items, benefit from the contrast. This technique is one of the most reliable ways to increase average check size without raising any prices.
Consider charm pricing carefully. Prices ending in .99 or .95 signal value and can increase sales volume - research shows charm pricing can boost sales by at least 24%. However, in upscale dining environments, rounded prices (ending in .00 or with no decimals) communicate confidence and quality. Match your pricing format to your brand positioning.
Describe value before revealing price. When guests read an appealing description of a dish - its ingredients, preparation, and sensory qualities - they form a value expectation before seeing the price. If the price meets or falls below that expectation, it feels reasonable. If guests see the price first and then read a generic description, the price feels arbitrary. Structure your menu so the description always precedes the price.
Pricing psychology tips:
- Remove dollar signs on full-service and fine-dining menus
- Nest prices at the end of descriptions, not in a separate column
- Lead each section with a premium-priced anchor item
- Use charm pricing (.99) for value-oriented concepts, round numbers for upscale
- Write compelling descriptions that establish perceived value before the price appears
- Test one change at a time so you can measure the impact on average check size
Managing Price Increases Without Losing Guests
Rising costs are unavoidable - the Bureau of Labor Statistics reported that restaurant menu prices increased 4.1% year-over-year as of December 2025, with full-service restaurants seeing increases of 4.9%. The question is not whether to raise prices, but how to do it in a way that maintains guest trust and visit frequency.
Raise prices strategically, not uniformly. Never increase every price on your menu at the same time. Instead, analyze which items have the largest gap between current price and target margin, and adjust those first. Spread increases across multiple menu updates so no single visit triggers sticker shock. A YouGov survey of U.S. consumers in 2025 found that 82% believe restaurant prices have risen in the past year and 37% are dining out less frequently as a result - guests are watching.
Increase prices on high-value, high-differentiation items first. Items that guests cannot easily compare to competitors - signature dishes, house specialties, unique preparations - can absorb price increases more easily than commodity items like basic burgers or salads. If guests can see the same item priced lower at three other restaurants, they will notice the increase. If your item is unique, the comparison point does not exist.
Add value when you add cost. When raising a price, consider adding a small upgrade that makes the increase feel justified - a better side, a premium garnish, or a larger portion. The incremental cost of the upgrade is often a fraction of the price increase, but it shifts the guest's perception from "they charged me more" to "I got more."
Use menu engineering to offset price sensitivity. Instead of raising prices on popular items that guests are most sensitive about (Plowhorses), improve the visibility and positioning of your high-margin items (Stars and Puzzles). Shifting your menu mix toward higher-margin items achieves the same financial result as a price increase without changing any prices. Read more about this approach in our Restaurant Menu Design Guide.
Monitor competitor pricing. Keep a quarterly log of competitor menu prices for comparable items in your market. This does not mean matching their prices - it means understanding the price range your guests consider normal. Pricing significantly above that range without a clear value justification puts you at risk. Pricing below it leaves money on the table.
Price increase strategy tips:
- Raise prices on 15-25% of items per update rather than adjusting everything at once
- Target increases on unique, hard-to-compare items where guests have no reference price
- Add a small value upgrade alongside any increase to reframe the narrative
- Use menu engineering to shift mix toward higher-margin items as an alternative to raises
- Track competitor pricing quarterly to stay within the expected range for your market
- Communicate value through descriptions and presentation rather than apologizing for prices
Beverage Pricing as a Profit Driver
Beverages are the most profitable category on most restaurant menus, and strategic beverage pricing can meaningfully improve your overall margins. Yet many operators apply food pricing logic to beverages - which leaves significant profit on the table.
Beverage margins far exceed food margins. A well-managed bar or beverage program generates gross margins of 70-85%, compared to 65-75% for food. Premium cocktails can reach 85-90% gross margin. The standard pour cost target - the beverage equivalent of food cost percentage - is 18-24%. This means beverages generate three to four times more gross profit per revenue unit than food.
Price beverages by perceived value, not pour cost. Because beverage costs are so low relative to selling price, there is more room for value-based pricing. A specialty cocktail that costs little to make but involves visible preparation, premium glassware, or a unique presentation can command a premium price that guests happily pay - because they are paying for the experience, not the liquid.
Use beverages to improve overall check profitability. A guest who orders a food item at 30% food cost and adds a beverage at 20% pour cost dramatically improves the blended margin of that visit. Train servers to suggest beverages with every order. Feature beverage pairings on your menu. Include a beverage upsell prompt on your digital ordering platforms.
Do not neglect non-alcoholic beverages. Specialty non-alcoholic drinks - house-made sodas, fresh juices, craft mocktails, premium coffee drinks - carry margins comparable to cocktails. With growing consumer interest in non-alcoholic options, a thoughtful non-alcoholic program adds a high-margin revenue stream while serving a growing guest preference.
| Beverage Category: | Typical Pour Cost: | Gross Margin: | Pricing Strategy: |
| Well spirits | 18-20% | 80-82% | Volume driver - price competitively |
| Premium spirits | 15-18% | 82-85% | Value-based - premium pricing justified by brand |
| Specialty cocktails | 10-15% | 85-90% | Highest margin - feature prominently |
| Wine (by the glass) | 20-25% | 75-80% | Price at 3-4x bottle cost per glass |
| Beer (draft) | 20-24% | 76-80% | Price for volume - competitive with local market |
| Non-alcoholic specialty | 10-20% | 80-90% | Emerging category - price as premium experience |
Beverage pricing tips:
- Set pour cost targets of 18-24% and track them weekly
- Feature your highest-margin specialty drinks prominently on the menu and table
- Train servers to suggest specific beverages by name rather than asking "anything to drink?"
- Price non-alcoholic specialty drinks at a premium - the margin supports it
- Use beverage pairings on your menu to increase attachment rate
- Review beverage costs monthly and adjust recipes or pricing when costs shift
Controlling Costs to Protect Your Prices
Pricing is only half of the margin equation. Controlling the costs behind your prices determines whether those prices actually deliver the profit you expect.
Standardize every recipe. If two cooks prepare the same dish with different quantities, your food cost is unpredictable. Documented recipes with exact measurements - enforced by portion scales and standardized prep procedures - ensure that your actual food cost matches your calculated food cost. Without standardization, your prices are based on assumptions, not reality.
Manage waste aggressively. Restaurants typically waste 4-10% of food purchased, and industry data shows that 70% of restaurant food waste comes from plate waste - portions that were served but not eaten. That waste is money you already spent on ingredients, labor, and storage that generated zero revenue. Track waste daily by category, and use the data to adjust prep quantities, portion sizes, and menu offerings.
Negotiate supplier pricing continuously. Most restaurants accept the first price their distributor quotes and only renegotiate annually. Review your top 20 items by spend monthly and compare pricing across at least two suppliers. Small percentage improvements on high-volume ingredients compound into significant margin gains over a year.
Use seasonal menus to manage cost volatility. Ingredient prices fluctuate with seasons, weather, and supply chain disruptions. A seasonal menu lets you rotate in ingredients when they are abundant and affordable, and rotate out items when their costs spike. This is more effective than repeatedly changing prices on permanent menu items, and it gives guests something new to try.
Leverage your menu mix. Promote high-margin items through better descriptions, menu positioning, server recommendations, and marketing campaigns. Shifting just a few percentage points of your menu mix from low-margin to high-margin items can have the same financial impact as a price increase - without touching a single price.
Cost control checklist:
- Document standardized recipes with exact quantities for every menu item
- Use portion scales for proteins, expensive ingredients, and items with high cost variance
- Track food waste daily by category and review trends weekly
- Compare supplier pricing monthly on your top 20 ingredients by spend
- Rotate seasonal items to take advantage of ingredient pricing cycles
- Promote high-margin items through menu placement, descriptions, and server training
Measuring Your Pricing Effectiveness
Pricing is not a set-it-and-forget-it decision. Track these metrics to ensure your prices are delivering the margins you need.
Actual vs. target food cost compares what you planned to spend on food to what you actually spent. If your actual food cost consistently exceeds your target by more than 1-2 percentage points, either your prices are too low, your portions are too large, your waste is too high, or your suppliers have raised prices without your noticing.
Average check size measures revenue per guest or per table. After pricing changes, track this metric weekly. A successful price increase or menu engineering change should show a measurable lift in average check. If average check stays flat after a price increase, guests may be trading down to cheaper items - which means the increase shifted mix without improving revenue.
Guest count trends reveal whether pricing changes are affecting traffic. A price increase that boosts average check but reduces guest count may net less total revenue. Track weekly guest counts for 8-12 weeks after any significant pricing change to catch traffic erosion early.
Menu mix percentage shows what share of orders each item represents. After pricing changes, compare your mix to pre-change levels. If a repriced item's mix drops significantly, guests are telling you the new price exceeded their value threshold for that item.
Prime cost percentage is the ultimate measure. If your combined food and labor cost is under 65%, your pricing structure is sound. If it is above 65% despite reasonable food costs, labor efficiency may be the issue rather than pricing.
| Metric: | What It Tells You: | Review Frequency: |
| Actual vs. target food cost | Whether prices cover ingredient costs | Weekly |
| Average check size | Whether pricing changes increase revenue per guest | Weekly after changes |
| Guest count trends | Whether prices are affecting traffic | Weekly for 8-12 weeks post-change |
| Menu mix percentage | Whether guests are shifting away from repriced items | Monthly |
| Prime cost percentage | Overall financial health of pricing + labor | Monthly |
| Contribution margin by item | Which items generate the most total profit | Quarterly |
Frequently Asked Questions
What food cost percentage should I target?
It depends on your restaurant type. Quick-service operations typically target 20-25%, casual dining targets 25-30%, and fine dining operates at 30-35%. But food cost percentage alone does not determine profitability - your prime cost (food + labor combined) is a better indicator. Keep prime cost under 65% of revenue as your primary benchmark.
How often should I review and adjust my menu prices?
Review your food costs and margins monthly. Adjust prices at least twice per year, or more frequently if ingredient costs shift significantly. Recost your top 20 items by volume monthly to catch supplier price changes before they erode your margins.
How much can I raise prices before losing guests?
There is no universal threshold, but the approach matters more than the amount. Small, strategic increases on select items (15-25% of the menu per update) are better tolerated than large, across-the-board jumps. Adding visible value when you raise a price - a better side, a premium ingredient - reduces perceived sticker shock. Track guest counts weekly for 8-12 weeks after any increase to measure impact.
Should I price based on competitor menus?
Competitor pricing is a reference point, not a formula. Track it quarterly to understand your market's expected range, but set your prices based on your own costs, margins, and the value you deliver. Matching a competitor's price on an item that costs you more to produce is a path to losses.
Is it better to raise prices or cut portions?
Research suggests that reducing portions by up to 20% does not meaningfully lower guests' value perception - but getting caught reducing portions damages trust far more than a transparent price increase. If you reduce portions, do so modestly and improve the presentation. If you raise prices, add a small value upgrade. Either approach works, but transparency builds long-term loyalty.
How should I price items for online ordering and delivery?
Be cautious about marking up delivery menu prices. Research from a major delivery platform study of over 4,500 restaurants found that menu price markups on delivery platforms led to significantly fewer sales and dramatically lower reorder rates. If you need to offset commission costs, consider adding a delivery fee or offering a slightly different menu with items optimized for delivery margins rather than inflating prices on existing items.
Why are beverage margins so much higher than food margins?
Beverage ingredients cost proportionally far less than food ingredients, and most beverages require minimal labor to prepare. A well-managed beverage program generates 70-85% gross margin compared to 65-75% for food. This makes beverages your highest-margin category - every beverage added to a food order significantly improves the blended profitability of that visit.
How do I handle seasonal ingredient price spikes?
Use a seasonal menu strategy. When an ingredient's cost spikes beyond your target, rotate that item off the menu temporarily and replace it with a seasonal alternative using ingredients that are currently abundant and affordable. This avoids the cycle of raising and lowering prices on permanent items, which confuses guests and erodes trust.
Should I use round numbers or .99 pricing?
Match your pricing format to your brand. Charm pricing (ending in .99 or .95) signals value and works well for quick-service and casual concepts. Round-number pricing (ending in .00 or with no decimals) signals confidence and quality, which suits upscale dining. Research shows charm pricing can boost sales by at least 24%, but the effect is strongest in value-oriented environments.
What is the biggest pricing mistake restaurants make?
Not knowing their actual food cost per item. Most operators know their overall food cost percentage from their P&L, but cannot tell you the margin on individual dishes. Without item-level costing, you cannot identify which items are losing money, which items deserve more promotion, or where price adjustments will have the greatest impact. Recipe costing is the foundation of all strategic pricing.
Related Resources
- Restaurant Menu Design Guide - Layout, descriptions, and menu engineering strategies that complement pricing
- Restaurant Marketing Guide - Promote high-margin items and drive traffic to support your pricing strategy
- Restaurant Online Ordering Guide - Optimize digital menu pricing for direct and third-party channels
- Restaurant Coupons and Promotions Guide - Use strategic promotions without undermining your price positioning
- Food Safety Guide - Proper handling and storage practices that reduce waste and protect margins
Share This!